


 11 / 15

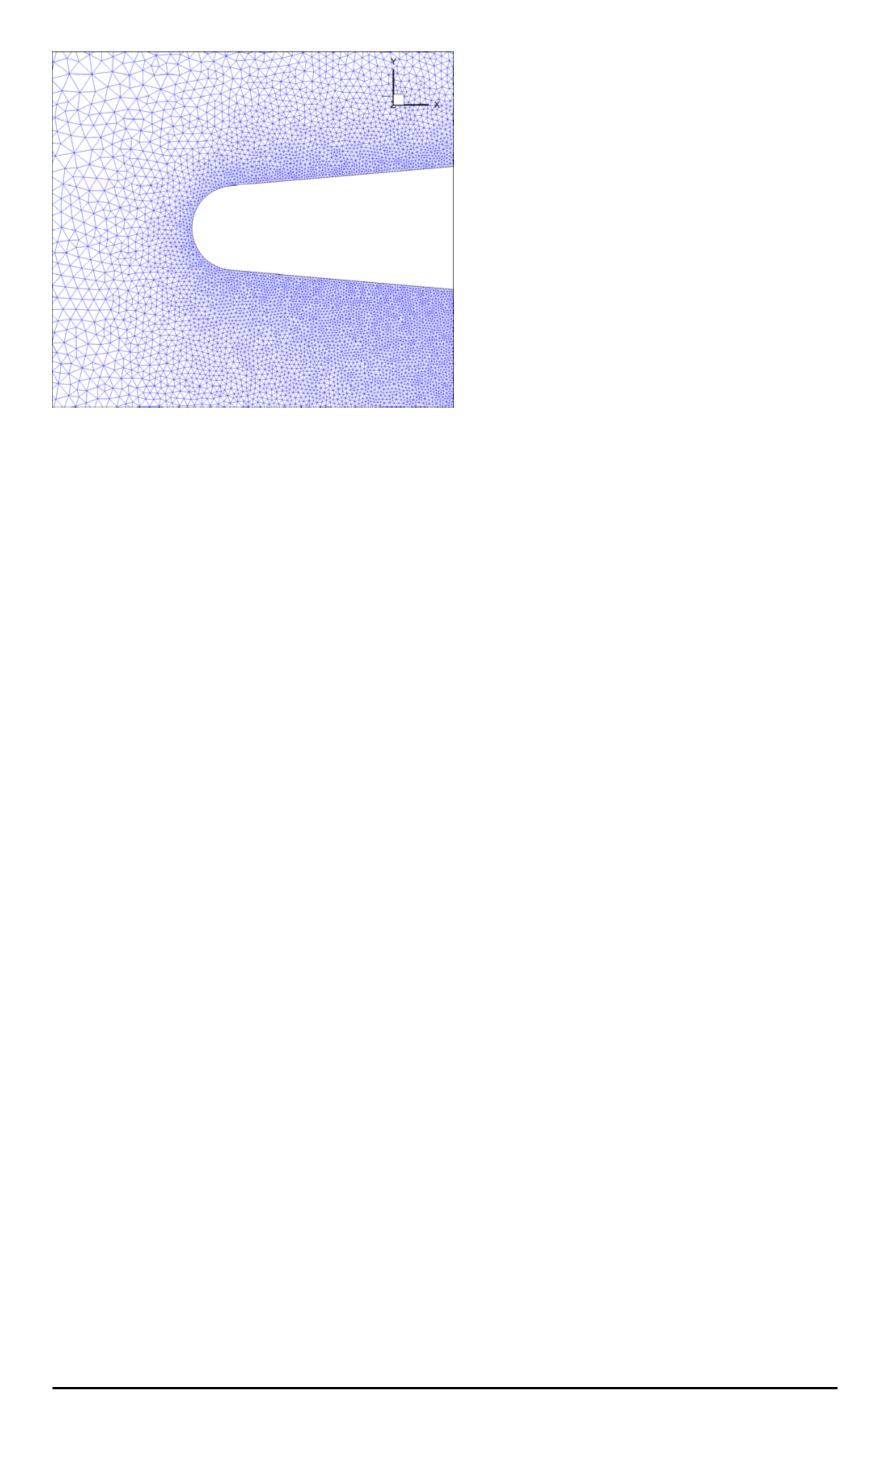
Рис. 7. The leading edge of the blunt-nose
wedge, computation mesh detail
the ram air in the lateral direction
are presented in [10]). The Mach
number of the ram air is estimated
from the experimental data using
the angle of the shockwave leaving
the wedge in photos corresponding
to the quasi steady flow modes. As
a result the input parameters at the
inflow boundary in the numerical
simulation are the following:
M = 7.0 or 4.5 (two quasi
steady modes were regarded); the
temperature is 100 K; viscousity
coefficient is equal to the air
viscousity coefficient at the entry
temperature.
For two model gas dynamic ducts (with sharp and blunt-nose edges) two
different meshes are created. These sets are three-dimensional in design,
they contain only one layer of cells in
Z
axis direction, so these meshes
will be regarded as two-dimensional. The mesh for the sharp-edge model
contains 363 500 triangular or quandrangular cells with a minimal cell size
of 2
∙
10
−
4
near hard surfaces. The Gmsh generator [20] was used to create
the mesh.
The enthropy layers generated near the decelerating point of the blunted
body can significantly affect the flow inside the ramjet air intake, so these
layers should have a good resolution. The resolution must be especially
high near the blunt-nose wedge leading edge. The mesh for the blunted
edge contains 1 200 000 cells with the minimal cell size of 0.01 mm near
the hard walls. Fig. 7 shows details of the mesh for the blunt-nose model
near the wedge leading edge.
All calculations were done in a complete calculation field without any
assumptions on the flow symmetry. On the one side it was used as an
additional verification of the solution quality, on the other hand furher
research is planned on the effects of the entry current non-uniform patters
and a small angle of attack.
The least squares method [13] with Michalak and Ollivier–Gooch
limiters [16] was used to calculate the physical variables gradients in the
cells centres. The calculations were done with Runge-Kutta second-order
method [19] with Courant number of 0.5.
The comparison of the calculation results with the experimental data is
presented in Fig. 8, 9. The upper part of each figure contains the Shlieren
image from the test, and the lower part — isolines of the calculated density
14 ISSN 0236-3941. HERALD of the BMSTU. Series “Mechanical Engineering”. 2015. No. 1