


 5 / 15

HPC end wall (the
A
sensor is positioned flush with the left end wall of the
HPC). A short period of time after the diaphragm opening a fall in pressure
is observed which results from the rarefaction waves fan. Further jumps
indicate perturbation reflected from the LPC end wall and its subsequent
reflection from the HPC end wall.
The next two oscillograph patterns (Fig. 3
b, c
, sensors
B
,
C
in Fig. 1)
demonstrate changing pressure in the LPC (the middle and the end part
of the segment). It is visible that the pressure in the middle part of the
segment increases when the initial shockwave passes through sensor
B
.
After approximately 3.3 ms sensor
C
(lower graph) displays reaction to
this perturbation. The further readings of this sensor are similar to the
ones described above (Fig. 2). The next jump in the oscillograph pattern
of sensor
B
(Fig. 1) in the middle of the LPC corresponds to the reflected
shockwave.
The data in Fig. 3 display shockwave interaction caused by the multiple
re-reflection of rarefaction jumps within the shock tube volume. Due to
this behavior several time intervals which can be regarded as quasi steady
can be identified. Some of these intervals being several milliseconds long
can be used for measurements.
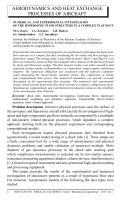
Results of the experiments on hypersonic flow in the receiver.
Shadow images of the driven gas flow around the models were recorded
by high-speed video cameras and Schlieren optical system. Fig. 4 presents
hypersonic flow near the 10
◦
wedge and 5
◦
semi-wedge. The initial
conditions were the following: driven gas in LPC was air at 1 mbar
pressure, the driver gas in HPC was air at 36 bar pressure, pressure in the
receiver segment was 4. . . 10 mbar. The 10
◦
wedge was positioned so that
its central longitudinal axis and the nozzle symmetry axis coincided. The
distance between the models was 15 mm.
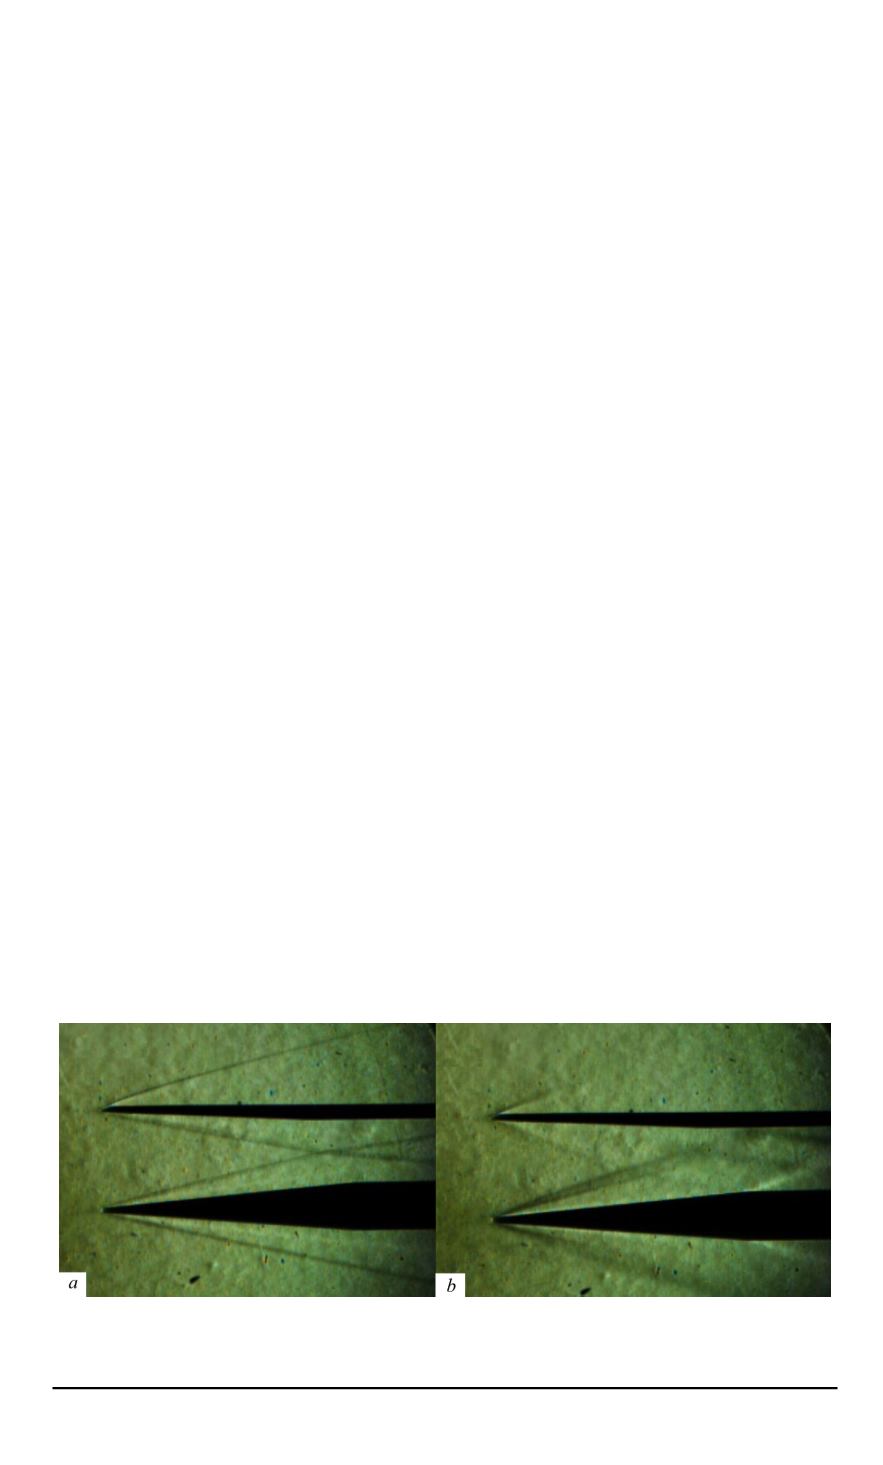
The air flow with the constant Mach number (Fig. 4
a
) lasts for about
15 ms. Then the flow parameters at the nozzle entrance change, with
Fig. 4. Hypersonic air flow (
a
) and its subsequent perturbation (
b
); images from the
shadow video sequence
8 ISSN 0236-3941. HERALD of the BMSTU. Series “Mechanical Engineering”. 2015. No. 1