


 8 / 15

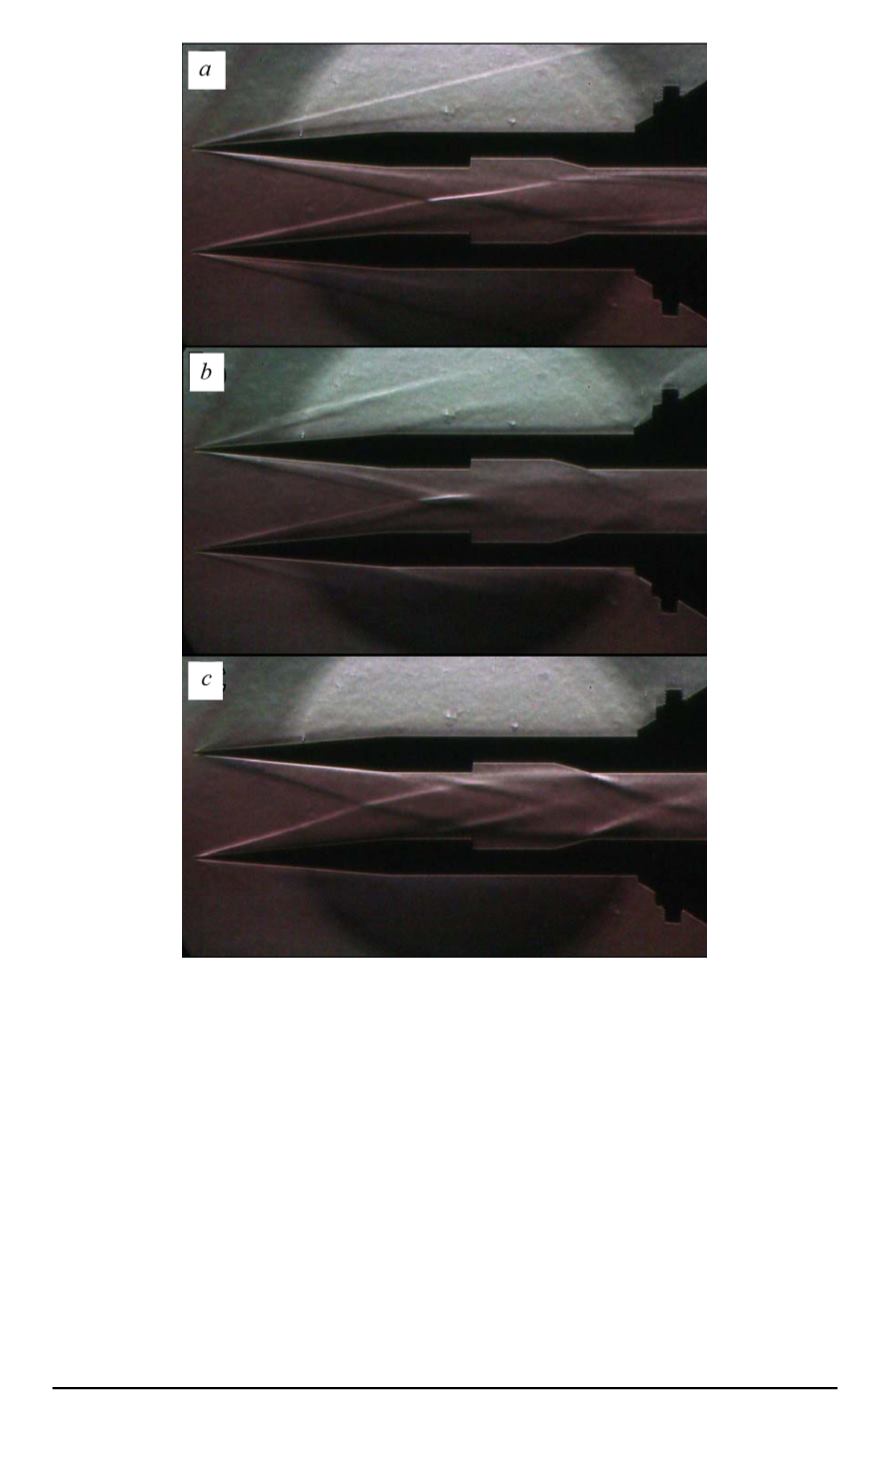
Fig. 6. Shockwave structure formed by the flow around two wedge models
transition from sharp to blunt-nose wedges. It can be observed that of
the model gas dynamic passageway was “filled” more rapidly with the
higher pressure flow region generated by the shock waves which is caused
by the head shock waves formation at the leading blunt-nose edges. From
this standpoint the bluntness plays undoubtedly a positive role. It should
be also noted that during the interaction of the blunt-nose shock wave with
the boundary layer local heating is observed near the surface [1, 12].
Numerical modelling of the flow in the gas dynamic passageway
model. Main equations.
For the numerical modelling of the gas dynamic
processes in the shock tube testing chamber which was described above,
let’s assume that the flow is described by Navier–Stokes–Fourier equations
ISSN 0236-3941. HERALD of the BMSTU. Series “Mechanical Engineering”. 2015. No. 1 11