


 4 / 15

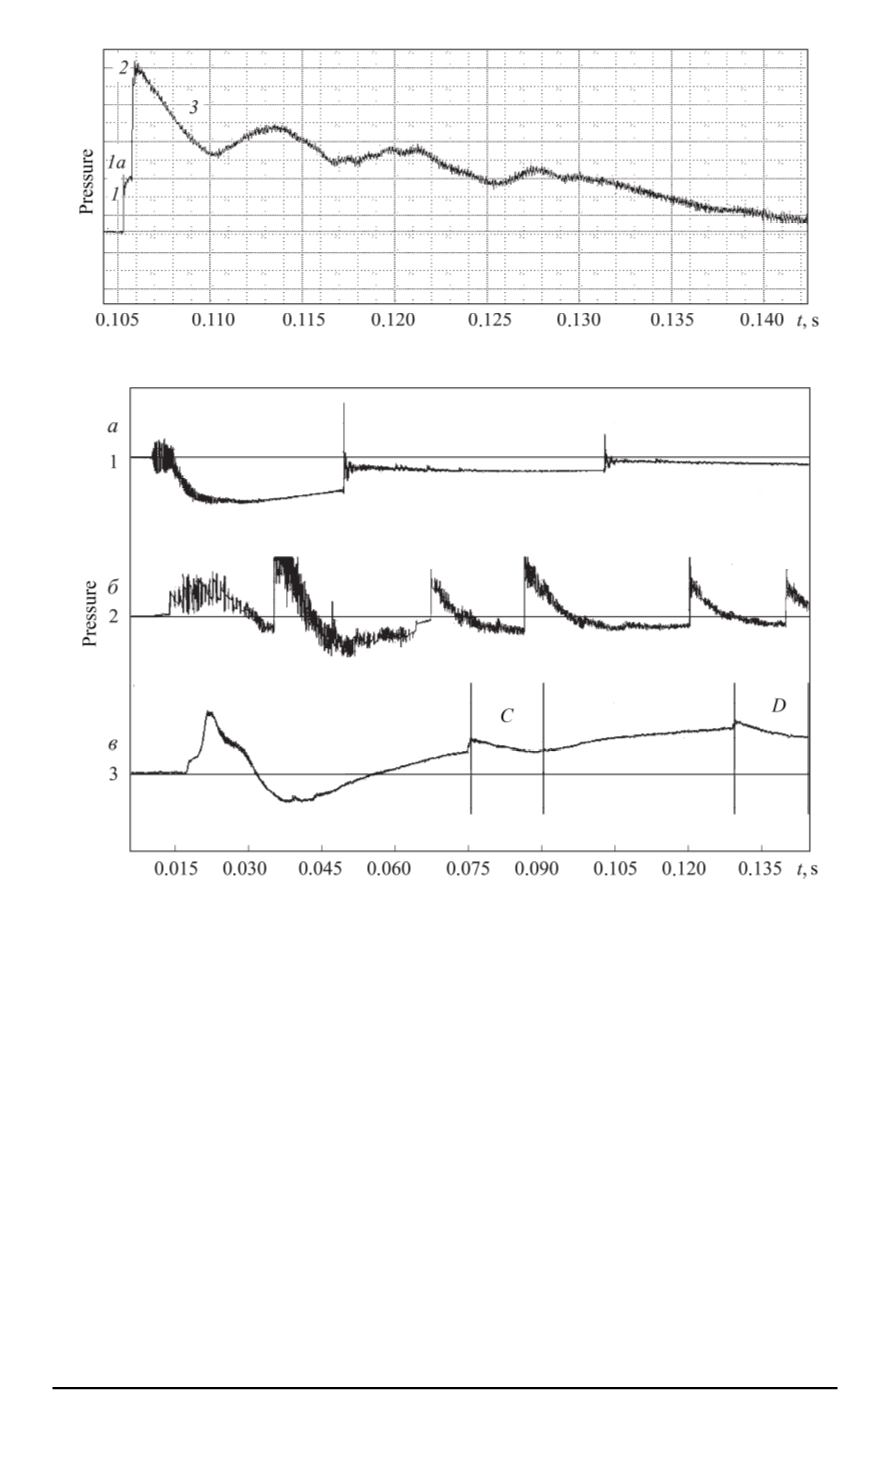
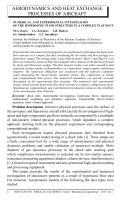
Fig. 2. Pressure sensor readings at the nozzle unit entrance
Fig. 3. Pressure sensor readings in the shock tube
initial shockwave. At approximately 300 ms before the shockwave reflected
from the right end wall (fragment
1a
in the oscillogram, Fig. 2) the gas
following the head shockwave passes through the cross-section where the
sensor is located. The phase in question is closely studied by means of
numerical simulation in [10], where the structure of the flow following
the reflected shockwave front was investigated under shock tube tests
conditions. The subsequent sharp increase in pressure (
2
, Fig. 2) and the
smooth decrease (
3
, Fig. 3) to the fluctuating values indicate the shock wave
reflected from the nozzle end wall and the quasi steady flow parameters
(about 10 ms) before the rarefaction wave.
The oscillograph patterns of the pressure sensors located in various
areas of the shock tube are presented in Fig. 3. The test initial conditions
were the same as in Fig. 2. The top graph indicates the pressure for the
ISSN 0236-3941. HERALD of the BMSTU. Series “Mechanical Engineering”. 2015. No. 1 7